
When diving into data analysis or machine learning, Linear Regression and Logistic Regression are two terms you’ll often encounter. They are essential tools in the data scientist’s toolbox and are widely used across various industries. But knowing when to use Logistic Regression vs Linear Regression can make all the difference in solving real-world problems effectively.
This guide will walk you through the concepts, differences, and practical applications of these two algorithms. By the end, you’ll have a clear idea of which one to choose and how to use them in your projects.

What Are Logistic Regression vs Linear Regression?
Let’s start with a simple explanation.
- Linear Regression predicts a continuous outcome. Imagine you want to predict a house’s price based on its size. The relationship between size (input) and price (output) can be mapped as a straight line.
- Logistic Regression, on the other hand, predicts a categorical outcome. For example, you might want to predict whether it will rain tomorrow or not (yes/no). Here, the output is not a number but a category.
Both methods fall under the umbrella of supervised learning, meaning they require labeled data to make predictions.
Why Do They Matter?
Understanding the difference between these two methods is critical. Imagine trying to predict a yes/no outcome with Linear Regression. The result would likely be nonsensical! Similarly, using Logistic Regression to predict a number would lead to errors.
Think of it this way: Linear Regression is like using a ruler to measure length, while Logistic Regression is like flipping a switch to decide between two options. Using the right tool for the job ensures accurate and meaningful predictions.
When to Use Linear Regression
Linear Regression is the go-to method for predicting continuous variables. Here are some examples:
- Predicting the price of a product based on its features.
- Estimating the temperature for the next day.
- Calculating the expected sales revenue for a business.
How It Works
Linear Regression works by finding a straight line (best-fit line) that represents the relationship between the independent variable(s) (input) and the dependent variable (output). The equation of the line is:
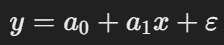
- y: The dependent variable (e.g., price).
- x: The independent variable (e.g., size).
- a0, a1: Coefficients that determine the line’s slope and intercept.
- ε: Error term.
Key Characteristics
- The relationship between variables must be linear.
- The output is continuous, not categorical.
- It minimizes the differences between predicted and actual values using least squares estimation.
When to Use Logistic Regression
Logistic Regression is best for predicting categorical variables. It is often used in classification problems like:
- Determining if an email is spam or not.
- Predicting whether a customer will buy a product.
- Classifying tumors as malignant or benign.
How It Works
Unlike Linear Regression, Logistic Regression doesn’t fit a straight line. Instead, it uses a sigmoid function to map predictions to probabilities between 0 and 1. The equation looks like this:
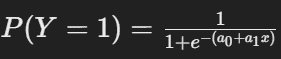
Here’s what’s happening:
- The sigmoid function ensures that the output is always between 0 and 1.
- The result represents the probability of the outcome being in one category.
For instance, if the probability of rain is 0.8, Logistic Regression predicts “yes, it will rain.”
Key Characteristics
- It works for categorical outcomes (e.g., yes/no, 0/1).
- It uses maximum likelihood estimation to find the best coefficients.
- It doesn’t require a linear relationship between variables.
Key Differences Logistic Regression vs Linear Regression
Here’s a quick comparison to clarify the distinctions:
| Feature | Linear Regression | Logistic Regression |
| Outcome Type | Continuous (e.g., price, age) | Categorical (e.g., yes/no, 0/1) |
| Purpose | Predicts values | Predicts categories |
| Method | Best-fit line using least squares | Sigmoid curve using maximum likelihood |
| Output Range | Any real number | Between 0 and 1 |
| Assumption | Linear relationship between variables | No linear relationship required |
Practical Scenario: A Tale of Two Models
Let’s say a hospital wants to predict two things:
- The length of ICU stay for patients with a specific condition (in days).
- Whether a patient will need ventilator support (yes/no).
- For the first question, the outcome is continuous (number of days). So, the hospital would use Linear Regression.
- For the second question, the outcome is categorical (yes/no). In this case, Logistic Regression is the right choice.
By selecting the appropriate model, the hospital ensures accurate and actionable insights.
Step-by-Step Guide: Choosing the Right Model
Not sure which regression to use? Follow these steps:
- Identify the Outcome Type
- Is the outcome a number (e.g., salary)? Use Linear Regression.
- Is the outcome a category (e.g., yes/no)? Use Logistic Regression.
- Check the Variable Relationships
- For Linear Regression, ensure the variables have a linear relationship.
- For Logistic Regression, no linear relationship is required.
- Consider the Data Distribution
- Linear Regression works well when data is evenly spread.
- Logistic Regression handles skewed data effectively.
- Validate Assumptions
- Linear Regression assumes no multicollinearity among independent variables.
- Logistic Regression requires that the predictors aren’t perfectly correlated.
- Use Visualization
- Plot your data to understand its nature. A scatter plot is great for Linear Regression, while a bar chart can help with Logistic Regression.
Multiple Linear vs Logistic Regression
Multiple Linear Regression involves using two or more independent variables to predict a continuous dependent variable. For example, predicting house prices based on size, location, and age. The relationship between the variables is assumed to be linear.
Multiple Logistic Regression, on the other hand, predicts a categorical outcome using multiple predictors. For instance, predicting whether a customer will purchase a product (yes/no) based on their age, income, and browsing history. Here, the outcome is a probability between 0 and 1, not a continuous value.
In short, both models involve multiple predictors, but the type of output they predict (continuous vs. categorical) differs.
Simple Logistic Regression vs Linear Regression
Simple Linear Regression involves one independent variable to predict a continuous dependent variable. For example, predicting someone’s salary based on their years of experience. It fits a straight line to the data, aiming to minimize errors.
Simple Logistic Regression, however, deals with binary outcomes (yes/no, true/false) and uses one independent variable. For example, predicting if a student will pass or fail based on their study hours. Instead of fitting a line, it uses a sigmoid curve to model probabilities between 0 and 1.
While both are simple, their outputs are fundamentally different: Linear for continuous values and Logistic for binary categories.
Logistic Regression vs Linear Regression Examples
Linear Regression Example: A real estate agent might use Linear Regression to predict the price of a house based on factors like square footage, number of rooms, and location. The output would be a continuous number (price).
Logistic Regression Example: A marketer might use Logistic Regression to predict whether a customer will buy a product based on their age, income, and browsing history. The output would be a probability between 0 and 1 (yes or no).
These examples highlight how Linear Regression predicts quantities, while Logistic Regression deals with classifications.
Common Mistakes to Avoid
- Using Linear Regression for Binary Outcomes: Predicting yes/no outcomes with Linear Regression can lead to meaningless results.
- Ignoring Data Assumptions: Not checking for multicollinearity or data linearity can reduce model accuracy.
- Overfitting: Adding too many variables to either model can cause overfitting. Always use regularization techniques if necessary.
Wrapping It Up
Both Linear Regression and Logistic Regression are powerful tools, but they serve different purposes. Linear Regression predicts continuous outcomes and works well for regression problems, while Logistic Regression is your go-to for classification tasks.
Think of them as specialized tools in a toolbox. Knowing which one to use ensures that your predictions are accurate and meaningful. And remember, don’t shy away from seeking expert help or using resources like Scikit-learn to implement these algorithms effectively. By understanding the basics and following the step-by-step guide above, you’ll be well on your way to mastering these essential techniques. Happy analyzing! 🎉
Thank you for reading! I would love to hear your thoughts and feedback in the comments section below.
Ready to dive deeper? Check out these resources:
- Linear Regression Algorithm Simplified: The Ultimate Backbone of Predictive Modeling
- Mastering Decision Tree Algorithm: How Machines Make Intelligent Decisions
- Decision Tree vs Neural Network: Unveiling the Key Differences for Smarter AI Decisions
- Gradient Boosting vs Random Forest: The Ultimate Guide to Choosing the Best Algorithm!
- Powerful Machine Learning Algorithms You Must Know in 2025
- Unlock the Power of Ensemble Methods: Bagging, Boosting, and Stacking Explained
- Logistic Regression Unleashed: How Odds Transform into Powerful Predictions